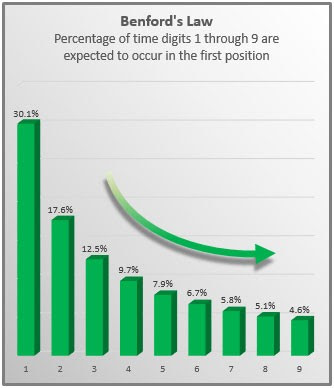
The Benford curve has been coming up a lot lately, a statistical oddity that says that in a collection of randomly assembled numbers, the leading digits of the numbers will occur normally in predictable rates.
Forensic accountants will tell you that this is a useful tool for pointing out areas of a ledger that need closer scrutiny. One can take, for example, the county-by-county vote count for either Trump or Biden and find the trump numbers closely follow the curve. In Pennsylvania, Michigan, and other select locations, Bidens curve more closely resembles a roller coaster track. This is true for the hotly debated states, but I got to wondering if there might be something going on here in Colorado.
Actually that's a pretty good bet as we have all mail in voting coupled with ballot harvesting, and essentially zero losses for Dems on the ballot even though the tax questions tend to lose. I pulled up the county level vote totals for the Rep, Sem, Libertarian, and one obscure minor party candidate and made a graph:
The Independents data follows the predicted curve fairly well. Trump isn't too far off except for the big jump at 9 which nearly everyone seemed to have. We have 64 counties, so 21 would be what one would expect to find in the ones column. Yes, I probably could have made the X axis denominated in percentages, but I didn't. So sue me. Or divide the numbers by 64. In your head.


No comments:
Post a Comment